CHALLENGE
The rising pressure to produce products cheaper and shorten lead-times in order to stay competitive, persuaded Coca-Cola Erfrischungsgetränke AG (CCEP Germany) to seek expert help in becoming more efficient.
Coca-Cola desired a single system to collect and analyse data across a line, a factory, and a region to compare and share the same metrics, and to implement the same meeting routines to drive KPIs and actions that address the True Causal Loss of individual production lines.
Coca-Cola Germany recognized that LineView™ users must be trained not only on how to operate the system to collect meaningful data; more importantly, Coca-Cola’s employees must be coached on how to interpret this data in a standard set of meeting routines, and how to drive KPIs with SMART actions to improve line performance.

SOLUTION
After facilitating a pilot project in Liederbach in summer 2015, Coca-Cola Germany decided to install LineView™ across 9 of their most significant production sites, totalling more than 24 lines over a period of roughly 2 years. Each line went through the following 4 stages to install and utilise the LineView™ system, and consequently go through an intensive coaching process from one of our OptimumFX Consultants in order to improve efficiencies:
STAGE 1:
Installation of the LineView™ system
- A dedicated LineView engineer installed and commissioned the system within 3-4 weeks.
STAGE 2:
LineView™ user training
- User-training sessions for all staff levels were conducted from machine operator to senior management.
- Each training session was delivered on the live system and supported with user manuals.
STAGE 3:
Data analysis and interpretation training
- A theoretical session explained the principles of Lean, the 6 Loss Analysis, and OptimumFX’s methodology of our IFA Formula.
- An “Effective Meetings” workshop was held to understand the importance of tactical and strategic reviews, the definition of a TOR/ agenda, and the generation of actions.

In order to guarantee results and ensure these are sustainable, OptimumFX provided each site with its “Governance Tool”. This provided a comprehensive visualisation of progression towards agreed goals.

STAGE 4:
Implementation of SIC and Management Routines
- Implementation of the following meeting routines:
- Short Interval Control every 3-4 hours for the Shift Leaders/Maintenance.
- Daily Performance Review Meeting.
- Weekly Strategic Performance Review Meeting.
- Each meeting had its own TOR/agenda defined in a workshop with the site team.
- Regular audits including feedback took place during each of the site visits.
After selecting LineView™ as their single system for performance management, Coca-Cola Germany also partnered with OptimumFX’s Manufacturing Excellence Consultants.
RESULTS
BEFORE & AFTER, Line ‘A’ | +7.2% SLE
Total Units: 60,845,942
SLE: 65.1%
Efficiency: 70.6%
Availability: 92.2%
Performance: 70.8%
Quality: 99.6%

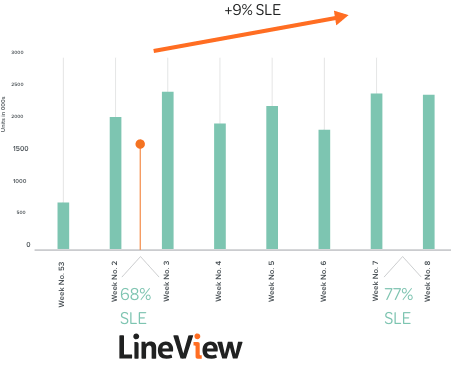
BEFORE & AFTER, Line ‘B’ | +9% SLE
Total Units: 19,972,463
SLE: 65.1%
Efficiency: 70.6%
Availability: 92.2%
Performance: 70.8%
Quality: 99.6%