Wouldn’t it be amazing if all equipment would operate all the time at full capacity producing good quality product?
Overall Equipment Effectiveness is a measure of what you actually made over what you could have made, in theory, over that timeframe. The difference between the ideal (theoretical) and actual situation is due to losses categorised into various metrics that provide you with excellent data to enable you to target areas of the OEE improvement plan.

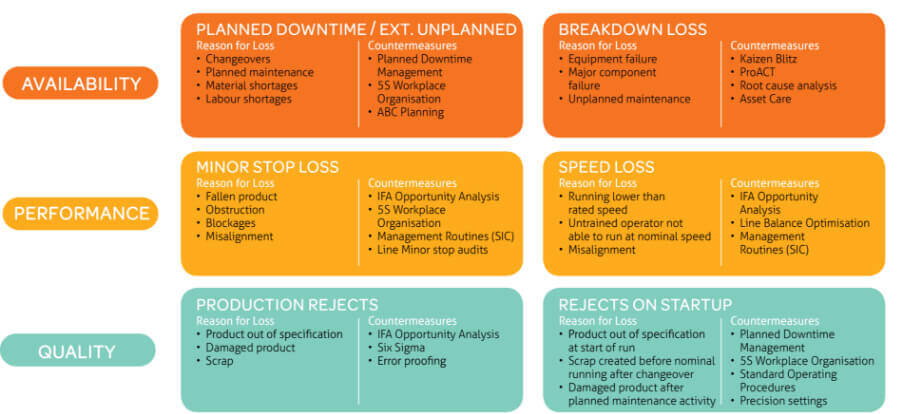
Reduce or eliminate the six losses of OEE and improve your score with OEE improvement strategy.
Understanding and categorising efficiency loss into six losses pinpoints area of focus that will improve the efficiency of the equipment. These six losses contribute to your OEE score and are categorized under Availability, Performance and Quality Loss.
What are the six losses of OEE?
- Planned downtime or external unplanned event
- Speed loss
- Breakdowns (>5mins)
- Minor stops (<5mins)
- Production rejects
- Rejects on start up
Calculate your Overall Equipment Effectiveness (OEE)
OEE is a widely used measure to determine performance against equipment capability. Factoring the metrics Availability, Performance and Quality, the better OEE improvements – the closer your efficiency is to World-Class performance.
Availability is a measure of the time the equipment was actually available to run within the specified duration, generally known as planned production time. The time it is not available is generally attributed to large duration of downtime such as product changeovers, breaks, breakdowns, etc.
Performance is a measure of how well the equipment performed when it was running. The loss of time in this category is mainly due to the equipment not running at its required rate and so producing products at a reduced rate.
Quality is a measure of time taken to produce a good quality product. The loss in this category is due to time lost to make inferior quality product.
OEE = A x P x Q
Optional Calculations
six loss of OEE
PLANNED DOWNTIME / EXTERNAL UNPLANNED EVENT
BREAKDOWN LOSS ( > 5 MINS )
MINOR STOP LOSS ( < 5 MINS )
SPEED LOSS
PRODUCTION REJECTS
REJECTS ON START UP
calculation
Planned Downtime / Total Production Time
Major Fault Time / Total Production Time
Minor Fault Time / Total Production Time
(Output / Ave Speed X Total Production Time)
(Output / Rated Speed X Total Production Time)
Rejects In Prod / (Good Output + Total Rejects)
Rejects On Start Up / (Good Output + Total Rejects)