Customer Stories
Dive into how LineView empowers manufacturers to transform production. We believe success is a two-way street (win-win), so explore how our customers win big, and how their success fuels our drive to keep innovating.
Featured Case Study

All Case Studies


The Results Speak for Themselves
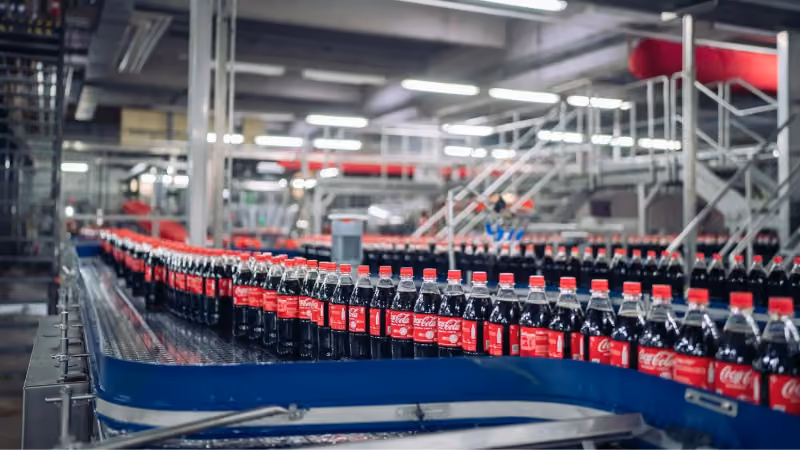
From single sites to global networks, here's what happens when beverage plants stop guessing and start acting on the right data.
“The tool makes it much easier to understand what’s happening on the production line in real time. It’s very user-friendly, so both operators and leadership can quickly see performance and identify issues. It’s been a solid support in driving awareness and improvements across the line.”
“Before Lineview, we could not capture short stoppages. Now every stoppage is recorded automatically, giving us reliable data for analysis and decisions.”
“It is not just the tool but the support around it that makes the difference.”
“This has helped us realise that we can improve beyond what was done decades ago. It has opened our eyes to areas that were in front of us the whole time, we just could not see them.”
“We wanted more than a vendor; we needed a strategic partner. Lineview had the enabling technology and deep operational expertise to support our transformation. Their team guided us through critical change management and helped us embrace new concepts to truly transform our business.”
“Applying Lineview to our lines, along with the support of the customer success team, has highlighted exactly where to pinpoint our efforts. We’ve really got to the heart of long-standing concerns and were able to mobilise the business with clear, unambiguous information.”