The Solution for Performance Audit & Capex Justification
Instant Data Insights with RapidView
RapidView™ collects data instantly using wireless sensing stations. A rugged portable solution, setup takes less than two hours with visualization tools that are ideal for equipment audits and CI initiatives to resolve problem areas rapidly and justify Capex.

Rapid Insights Anywhere: Portable Data Mastery
RapidView is a portable system which sets up in under two hours, capturing wireless data via battery-powered sensors. It provides built-in tactical reporting and operates independently of existing infrastructure, allowing rapid analysis and visibility of top losses.
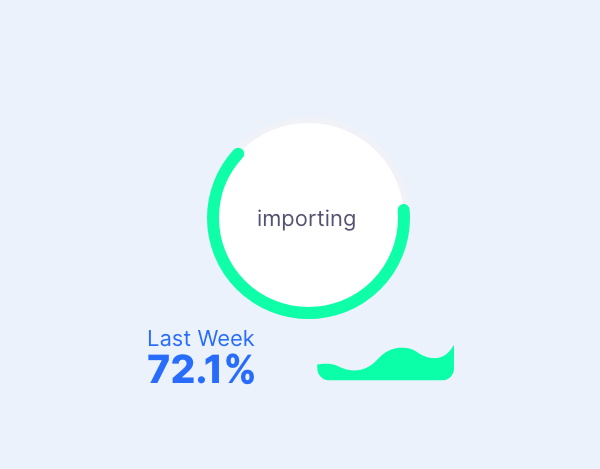
PORTABLE, WIRELESS DATA CAPTURE
Easy to set-up in less than 2 hours
Minimize set-up time with portable wireless automatic data capture via battery powered sensing stations. This super portable hardware gives you clear insights into machine performance for quick and accurate decision making.
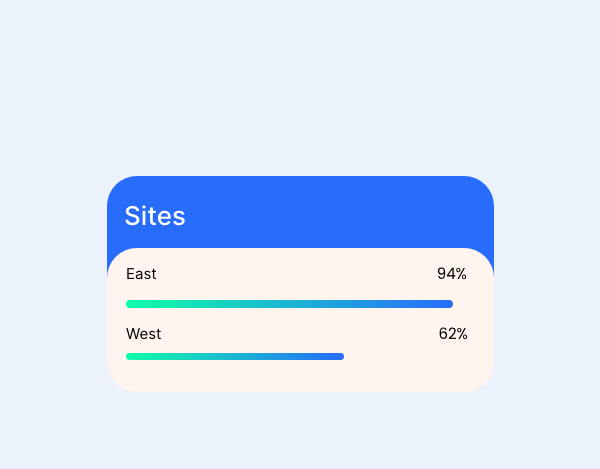
CONFIGURABLE REPORTING
Total quality management without piles of papers and shift sheets
We understand that a seamless reporting system is essential for collaboration, ownership and recognition of significant achievement in work. With RapidView you can configure reporting to align with your team’s KPIs and individual KPIs improving employee satisfaction and performance over time.
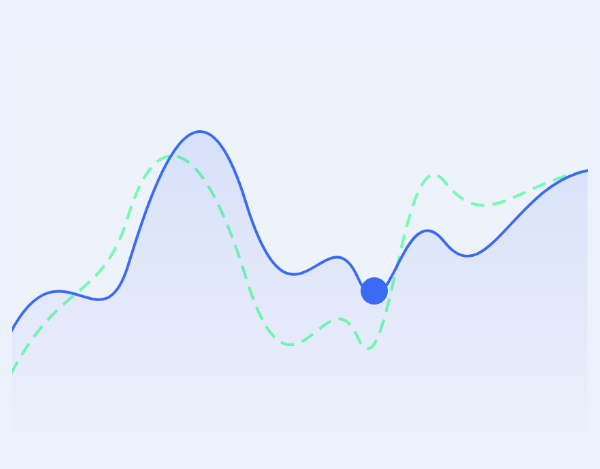
LOSS ANALYSIS
Target OEE improvements and drive effective decisions with 6-Loss detailed analysis
RapidView performs 6-Loss Analysis, a critical process for improving Overall Equipment Effectiveness (OEE). By tracking downtime, speed losses, and other factors, it empowers informed decisions, enhancing production efficiency.
Features of RapidView
In addition to portability, RapidView is preinstalled with a set of features enabling your team to improve productivity on the go.
Loss Analysis
RapidView empowers operations and continuous improvements teams with detailed 6 loss analysis to make significant improvements in availability, performance and quality.

Configurable KPI (OEE, Efficiency, MTBF, MTTRR, etc.)
Real-time feedback flags urgent problems like machine stoppages for immediate corrective action. Track Mean Time Between Failure/To Repair of each machine.

Cycle Time/Speed
Visualize cycle time/speed to ensure design speed is being maintained.
Real-time Feedback
Monitor lines or individual machines to identify lost performance and drive efficiency improvements.

Drilldown Capability
Drilldown to analyze productivity loss by line, area, machine and more.
Customer stories
Dive into how LineView empowers manufacturers to transform production. We believe success is a two-way street (win-win), so explore how our customers win big, and how their success fuels our drive to keep innovating.
Case Study

Coca-Cola Enterprises selects Lineview™ as their system of choice.
Over a three-year period, LineView™ has been implemented on every production line in Europe to help increase efficiency and reduce manufacturing costs.
Case Study

AB InBev China achieves Goals through Data, focus and action.
The world’s largest brewer, AB InBev, recommended LineView™ to their Chinese bottling plant based in Wuhan to remedy the company’s struggles with efficiencies.
Case Study

Lineview unlocks £5.4M in capacity increase for Britvic Plc through Line Balancing Optimization.
By combining expert training, proven methodology, and collaborative implementation, LineView helped Britvic achieve tangible results and gain a competitive edge in the beverage market.
