17th July 2025, London, UK – A recently launched global benchmark report from Lineview, a leader in manufacturing intelligence, shows that the top-performing manufacturers are those taking the opportunity to upskill employees, empowering them to use production line data to manage proactive process improvements.
In contrast the report also highlights that others, with higher crewed time, are seeing comparatively lower efficiency results. In one such example, 90% crewed time with 44% asset utilisation showed just 57% efficiency recorded. By making incremental improvements in areas, such as this, companies can expect to unlock greater productivity and value from existing operations.
Lineview’s data was collected from 33 global customers, across 137 sites and 557 production lines, and compared performance across six major types of food and beverage production lines – setting specific criteria for the data collected to ensure its credibility. The data gathered provides evidence that diversity of food and beverage production is significantly affecting operational costs and carries an environmental impact.
Performance Gains Come from Smarter Data
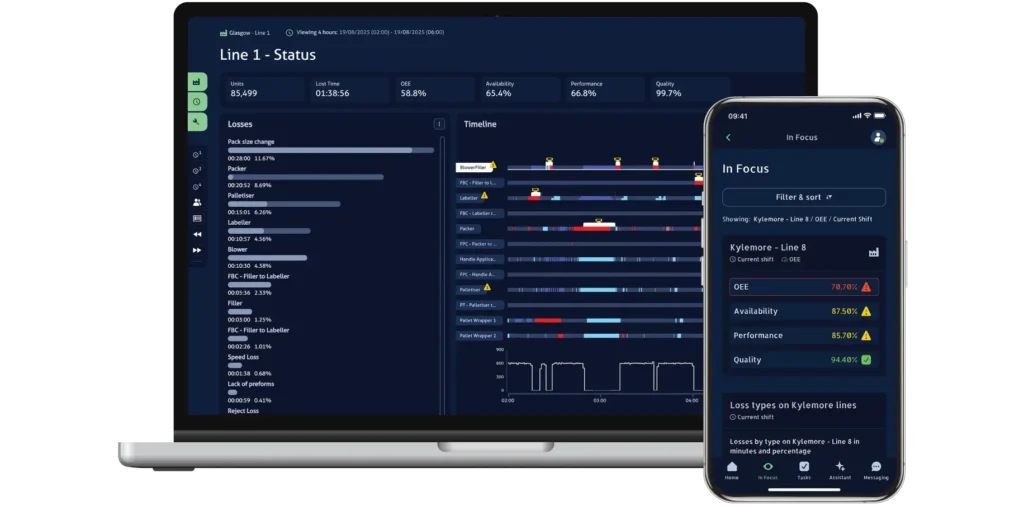
Despite the operational advantages, many manufacturers continue to rely on manually recorded data. Often inaccurate or out of date before it moves into a respective review cycle, non-standardised data entry criteria can mean operators record information differently, which leads to unreliable metrics and flawed comparisons. Furthermore, as manufacturing sites scale or multiply, such spreadsheet management becomes unmanageable, time-consuming and error prone.
“The reality is that production lines are capital-intensive, high-throughput environments,” said Ian Rowledge, Founder of Lineview. “Customers recognise that even small operational inefficiencies can accumulate to have a significant impact on the bottom line, leading to substantial losses when you’re producing thousands of units an hour. By capturing real-time insights, rather than managing production lines using historical data – which is like trying to drive a car forwards, whilst looking in the rear view mirror – manufacturers can make smarter decisions in the moment, improving production, quality and profitability.”
Key Findings:
- OEE is underperforming across the board, indicating productivity leakages
- Non-returnable glass bottles (NRGB) production is the second least efficient, likely due to glass lines experiencing more minor stops and breakdowns rather than speed losses
- NRGB lines have the lowest OEE at 42% and the lowest availability at 78%
- NRGB recorded the highest planned downtime (34% of all loss percentage) among all major bottle line types
- PET lines perform at a mid-level, with 59% efficiency, 84% availability and an OEE of 50%
- Cans have the second highest efficiency (62%) and OEE (53%) of the six major line types
- Can damage now accounts for a third of all losses on can fillers
- RGB and RPET lines show low OEE at 49% and 46%, with efficiency at just 56% and 51%, despite high availability levels of 88% and 90%
- Bag in Box exhibits the highest level of performance and efficiency with 64% OEE and 78% efficiency and 83% availability
- Aseptic lines have an average OEE of just 43% and efficiency of just 53%
Cumulatively, the data shows that manufacturing performance and efficiency across the food and beverage industry is heavily influenced by the complexity of products, packaging and manufacturing processes. The report also suggests that growing demand for healthy, sustainable products is negatively impacting manufacturing performance as production lines struggle to adapt.
Setting the Performance Standard
The Lineview global benchmarking report was created to help companies understand their performance in the industry by enabling them to compare key data points collected from some Lineview customers and their production lines. By providing a centralised view of performance in this way, organisations are then able to determine where they are in the performance hierarchy – and critically identify key areas for improvement. For those benchmarking themselves against a fellow subsidiary or competitor, the report also provides interesting insights on what good performance should look like and where their company performance stands in comparison to others. Lineview hopes the data will help companies set goals and targets to measure continuous improvement.
Consumer Trends Impact Sustainability Targets
As consumer trends evolve and the drive to demonstrate sustainability continues, manufacturers are likely to invest in more sustainable packaging solutions – such as Returnables. In parallel, the industry faces a number of operational challenges here, such as tight margins, so the viability of investments faces additional scrutiny. A further challenge is ageing production processes and lines that can no longer cope with the growing diversification and complexity of today’s evolving consumer demands.
“I don’t think there is anyone who would disagree that the food and beverage manufacturing sectors are facing a perfect storm of rising costs,” concluded Rowledge. “Many are facing tighter sustainability goals, adjusting against the rising tide of skills shortages and increasing regulations, whilst continually seeking opportunities to find efficiency gains. But until accurate recording of data is really put under the spotlight, the industry is up against the reliability of manual updates. Reviewing production lines against poorly recorded data simply serves to undermine any improvement efforts in play.”
You can download your copy of the Lineview benchmarking report now.
Methodology
Lineview’s Global Benchmarking Data Report analysed global production performance across 33 leading food and beverage companies over 12 months.
The report compares Overall Equipment Effectiveness (OEE), efficiency and availability across six key line types: Non-Returnable Glass Bottles; cans; polyethylene terephthalate (PET); Returnable Glass Bottles and Returnable PET, and Bag-In-Box (BIB).
Additionally, the report examines how drives to improve cost and carbon efficiency through lightweight materials are impacting production reject rates. It also compares crewed time* with efficiency across individual production lines to understand the factors driving exceptional performance at some companies.
Note: Crewed time* refers to the total time included in the OEE calculation. Availability is defined as the measure of when a line is ‘available’ to run, excluding Planned Downtime and External Losses.
No customer names have been identified or cited in this report and no individual customer’s data is being made available, nor will Lineview share any opinions on individual company approaches to data management and analysis.
The data was collected from January 1st 2024, to December 31st 2024.